Rebalance
The Reblance section of the Portfolio Rebalancer™ interface is where users can start the rebalancing calculations and view the results. The overall interface is designed to make it easy for users to understand the impact of the rebalancing process and to implement the recommended changes in their portfolios effectively.
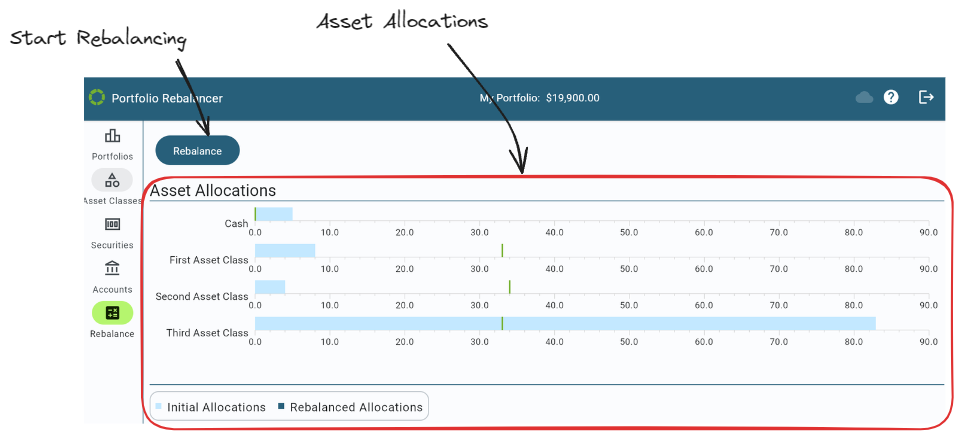
Initial Rebalance Screen
The initial Rebalance screen helps users quickly assess how their portfolio’s current state compares to the desired allocation, setting the stage for rebalancing.
Main Features
-
Asset Allocations: The initial Rebalance screen provides a visual representation of the current asset allocations in comparison to their target allocations. Each asset class is displayed with a horizontal bar graph that indicates the current percentage allocation. The light blue bars represent the current allocation levels, while the vertical green lines indicate the target allocation.
-
Rebalance Button: When clicked, this button initiates the process to calculate the transactions needed to bring the portfolio as close as possible to the target allocations.
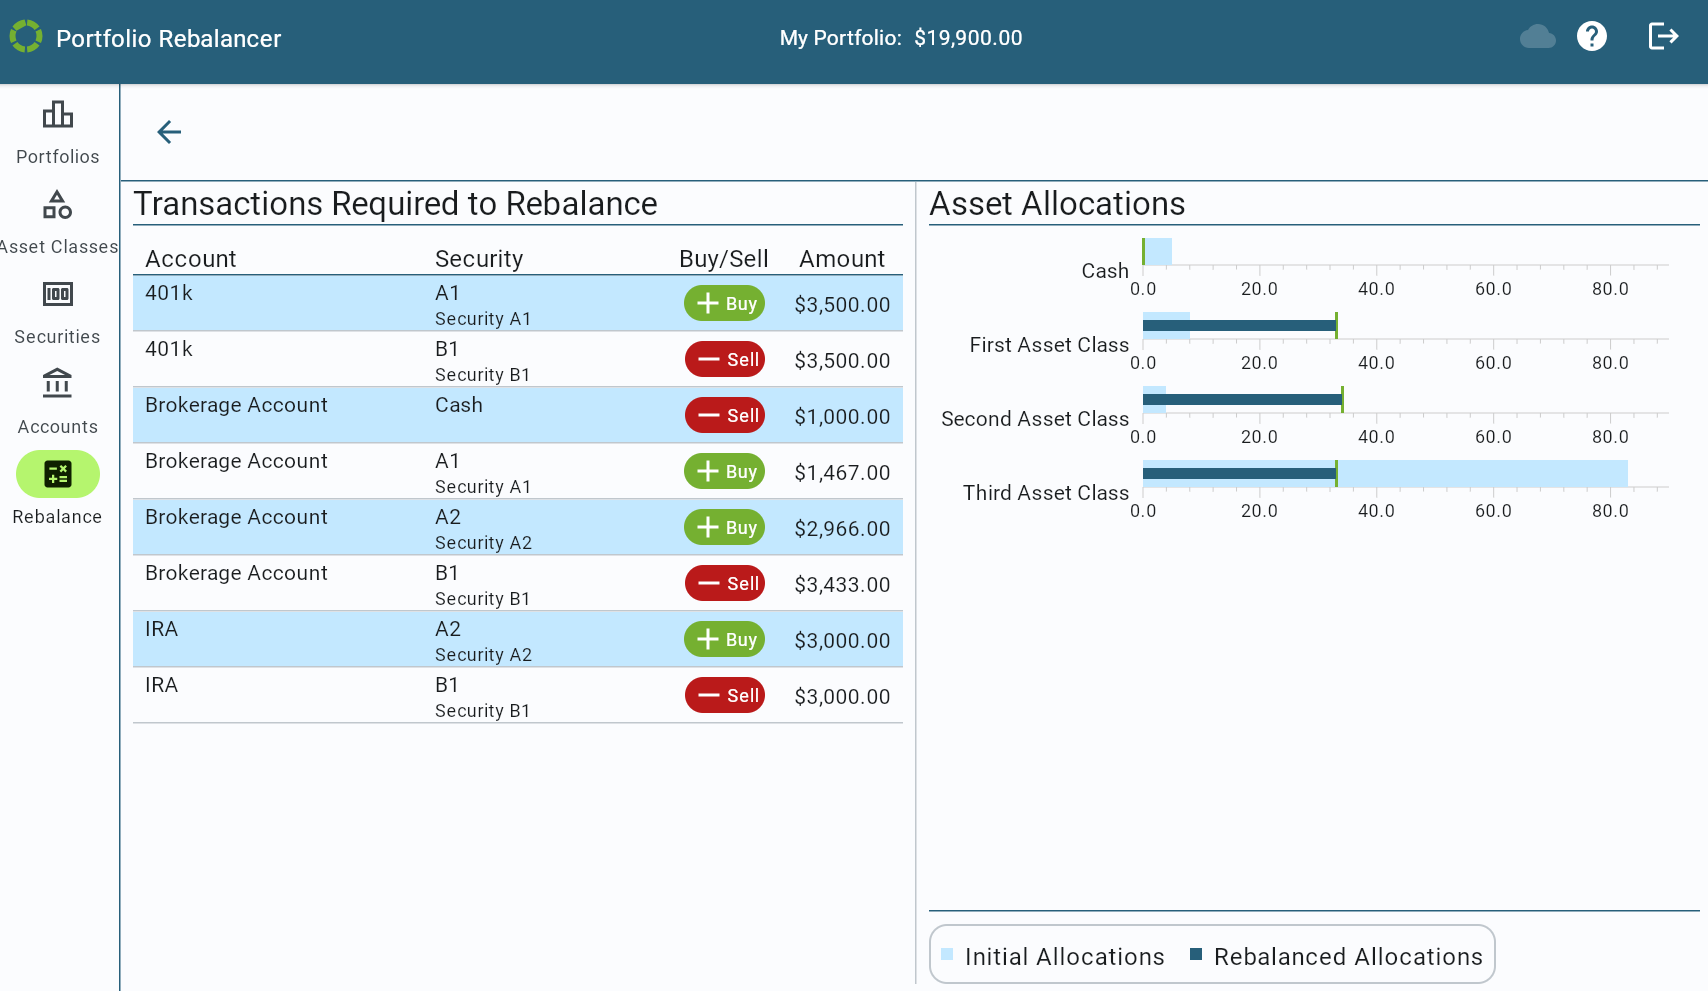
Results Rebalance Screen
After the rebalancing calculations have been performed, the interface provides a detailed breakdown of the transactions needed to bring the portfolio in line with its target allocations, or as close as possible.
Main Features
-
Transactions: On the left side, a table titled “Transactions Required to Rebalance” lists the accounts, securities, and the actions (Buy/Sell) with the corresponding amounts necessary for rebalancing. Each entry specifies the security and whether it should be bought or sold, along with the exact dollar amount.
-
Asset Allocations: On the right side, the “Asset Allocations” section presents a comparison between the current and rebalanced allocations. The light blue bars represent the initial allocations, while the dark blue bars indicate the allocations that would exist after the rebalancing transactions are executed. The green vertical lines mark the target allocations. This visual comparison allows users to see how the recommended transactions will adjust their portfolio to better align with their investment goals.
Example With Cash-Only from Brokerage Account
The above rebalancing illustrates that the calculated transactions will bring the portfolio perfectly in line with the user’s target allocations. This was possible because there were no additional restrictions set on any accounts or holdings.
In this scenario, the rebalancing has been performed with the restriction set to only use cash from the “Brokerage Account.” With this setting, no transactions that require selling any investment other than Cash will be used in the Brokerage Account.
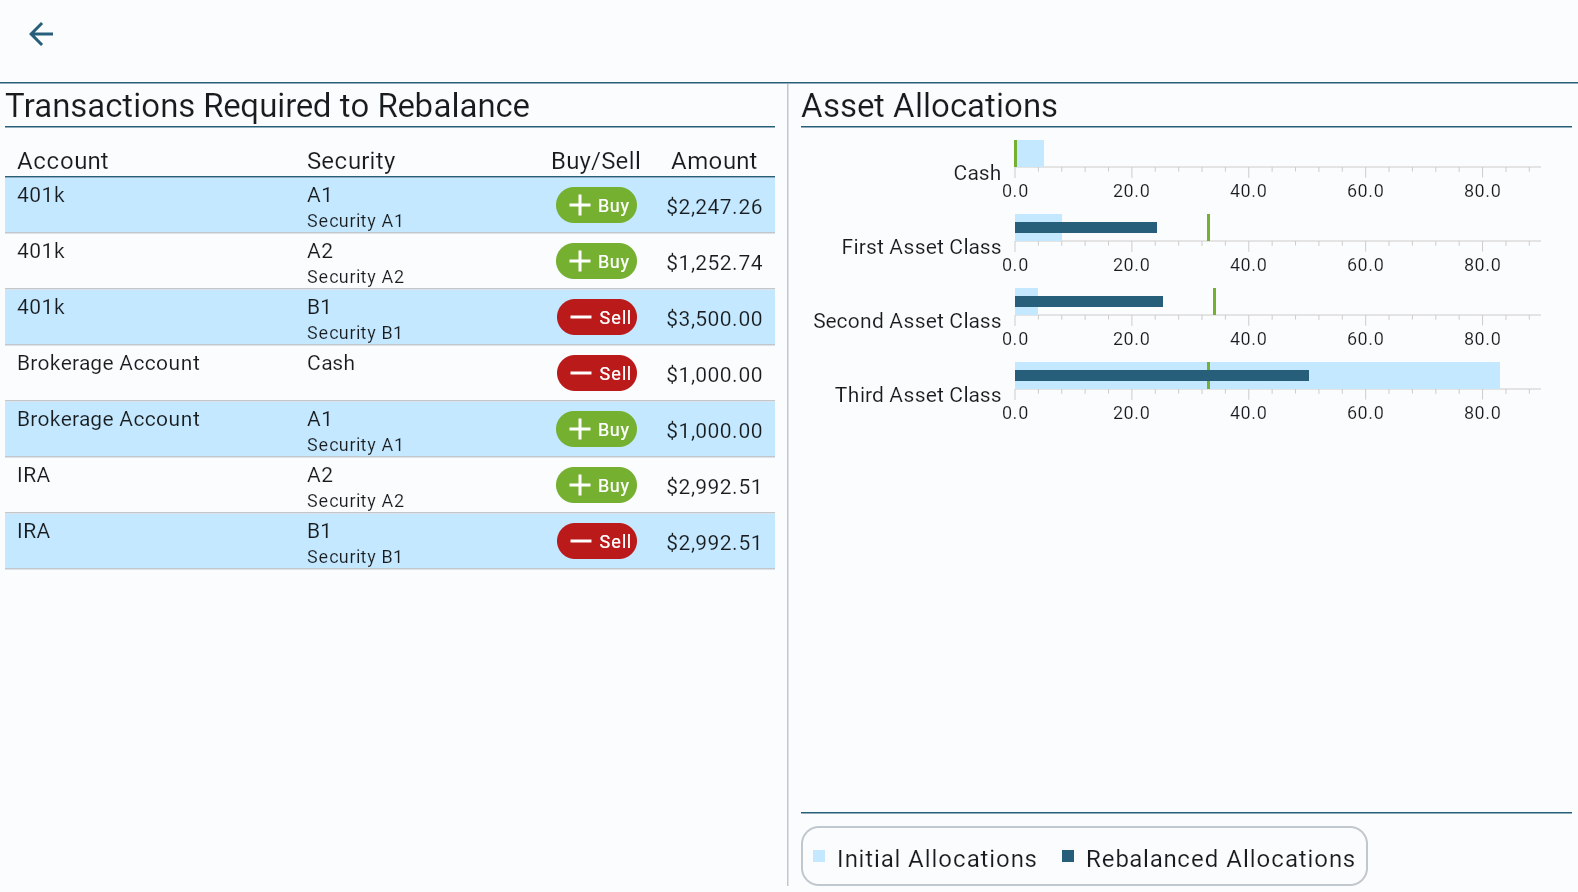
As can be seen in the above results, the “Transactions Required to Rebalance” section on the left side shows the specific buy and sell actions needed to achieve the target allocations while adhering to this restriction.
On the right side, the “Asset Allocations” graph visually compares the initial allocations (light blue bars) with the rebalanced allocations (dark blue bars). The green vertical lines represent the target allocations for each asset class. This comparison shows that the calculated transactions will bring the portfolio’s asset allocations closer to the target allocations, but they are not able to match them exactly. This is because there are insufficient assets in the portfolio’s other accounts to compensate for the inability to sell any non-Cash holdings in the Brokerage Account.
This feature allows users to partially rebalance their portfolios while maintaining strict control over which assets are utilized, making it ideal for scenarios where specific liquidity constraints or tax implications need to be considered.